


How Lettuce Entertain You benchmarks every location to give its operators a fair read
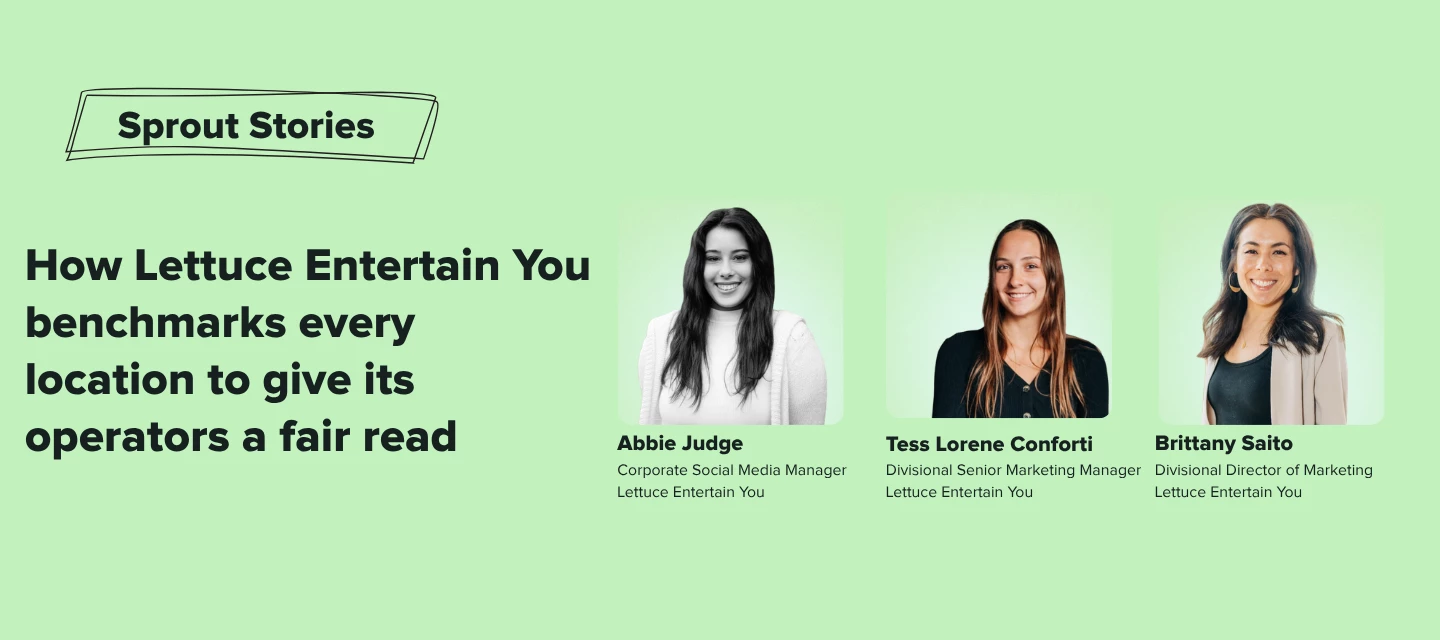
An operator looking at one restaurant's follower count has no way to tell a content problem from a platform problem. A slow month just reads as failure. The social team at Lettuce Entertain You closed that gap by benchmarking follower growth across every location in Sprout Social.
Corporate Social Media Manager Abbie Judge (
Fair goals need a range
With the whole spread visible, an operator can see whether they're performing above average for a brand their size, or whether everyone dipped that quarter on an algorithm change rather than anything they did. The team can also see which locations sit far enough outside the range to need a look, in either direction. Those quarterly reports go to executive leadership as well as operators, so one benchmark both grounds an operator's goals and shows leadership how the portfolio is moving.
"Sprout helped us compare the accounts and make a more informed decision about where to focus our efforts. For this brand, bringing the location pages together made more sense for our guests and our team." — Brittany Saito, Divisional Marketing Director at Lettuce Entertain You
The how
- Benchmarking growth across the portfolio: The team lines up follower growth for every location side by side in My Reports, so goals get set off the actual range and average rather than one account's trend line. They read content performance the same way in the Post Performance Report, which is what shapes the next monthly content calendar.
- Building a report per audience, not per template: Every operator thinks about success a little differently, so the team builds each report around what that brand counts. Custom widgets pull the metrics that matter to them, and the Text Asset and Image Annotation widgets put context beside the number, explaining why it moved or what tied a spike to a ticketed event or an influencer partnership.
- Tagging what guests keep bringing up: Tagging is what let the team organize across brands. They tag to surface the themes guests raise repeatedly and read it back in the Tag Performance Report, and they filter to pull every location's content into one view, which wasn't possible before. Inbound influencer requests go into the same catalog, and creator evaluation happens in Influencer Marketing by Sprout Social.
- Settling a page-structure question with data: For one brand carrying separate location pages, the team compared those pages against the main-brand account side by side and saw engagement, reach and community splitting instead of compounding. With the numbers in front of them, folding the location pages into the main brand was an easy decision.
- Publishing at festival speed: During Windy City Smokeout, the team pushes anywhere from 60 to 140 posts and Stories a day through the Publishing Calendar, including emergency weather and schedule updates that have to reach thousands of attendees immediately. UTM tracking in their event recap reports ties ticket sales back to social.
- Working the inbox before anything else: Every location's comments and mentions land in one Smart Inbox queue, and the team works that first. Automated Rules clear spam before anyone sees it and flag accounts with large followings, which helps them understand who's in their audience. They're straight about the gap. Every post still gets tagged by hand, and closing is next. Working one queue instead of every native platform gives each person about 2 hours a week back.
The business impact
Each operator's report is built around how that brand measures success rather than a template someone else designed, and operators come back with evidence of their own, telling them about guests walking in saying social is how they first heard about the restaurant. Executive leadership sees the same portfolio view at the same time. And the 2 hours a week the team gets back from working in one place goes into what compounds: creator relationships, sharper content strategy and better reports next quarter.
If you manage social for more than one brand, what would your operators understand differently if they could see the full range and where the average sits?