Solved

Presenting Social Data Reports

  • 21 December 2023
  • 7 replies
  • 385 views

Userlevel 4
Badge +1

I love reviewing all the data that comes with social media. However, I am spending way too much time building my monthly report that I share with management. 

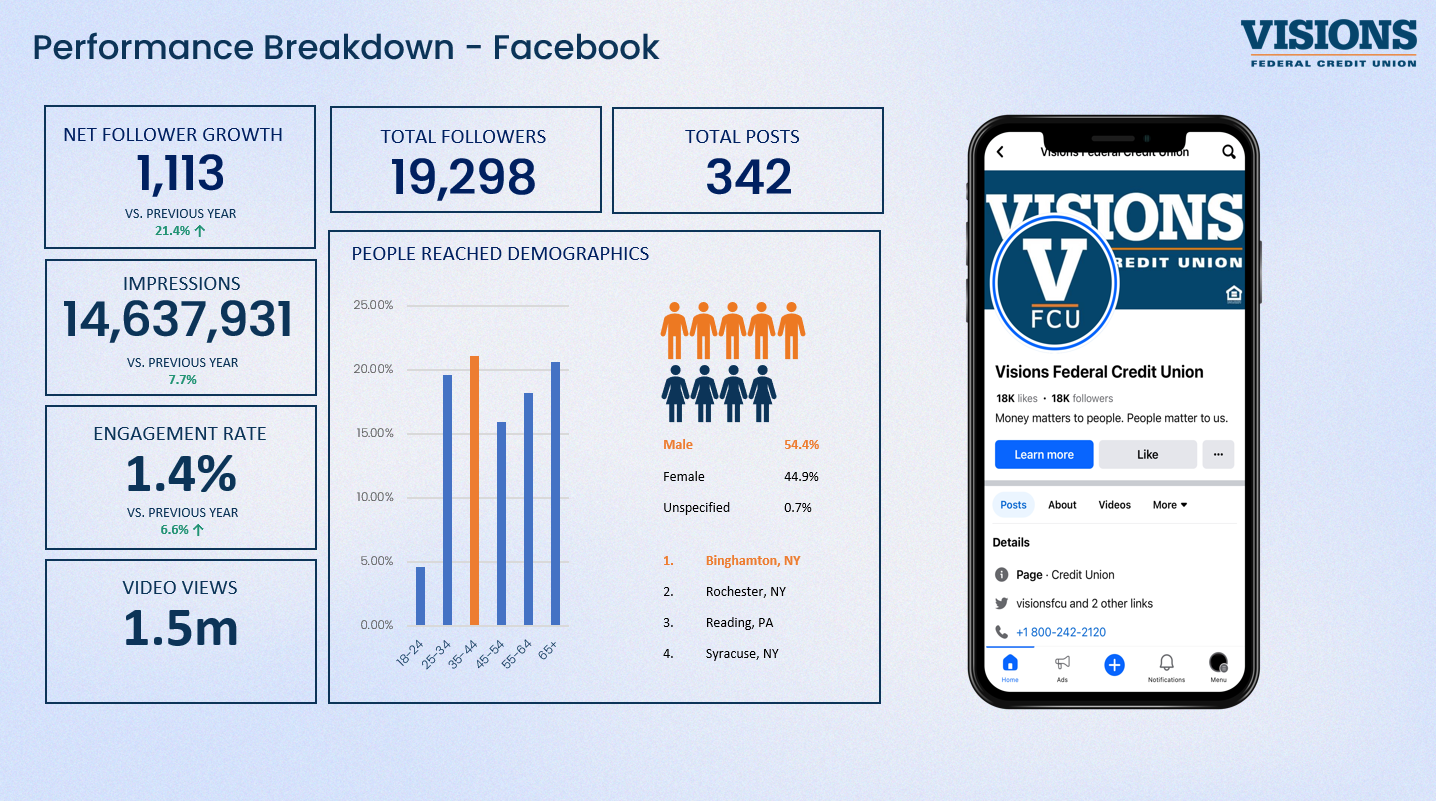
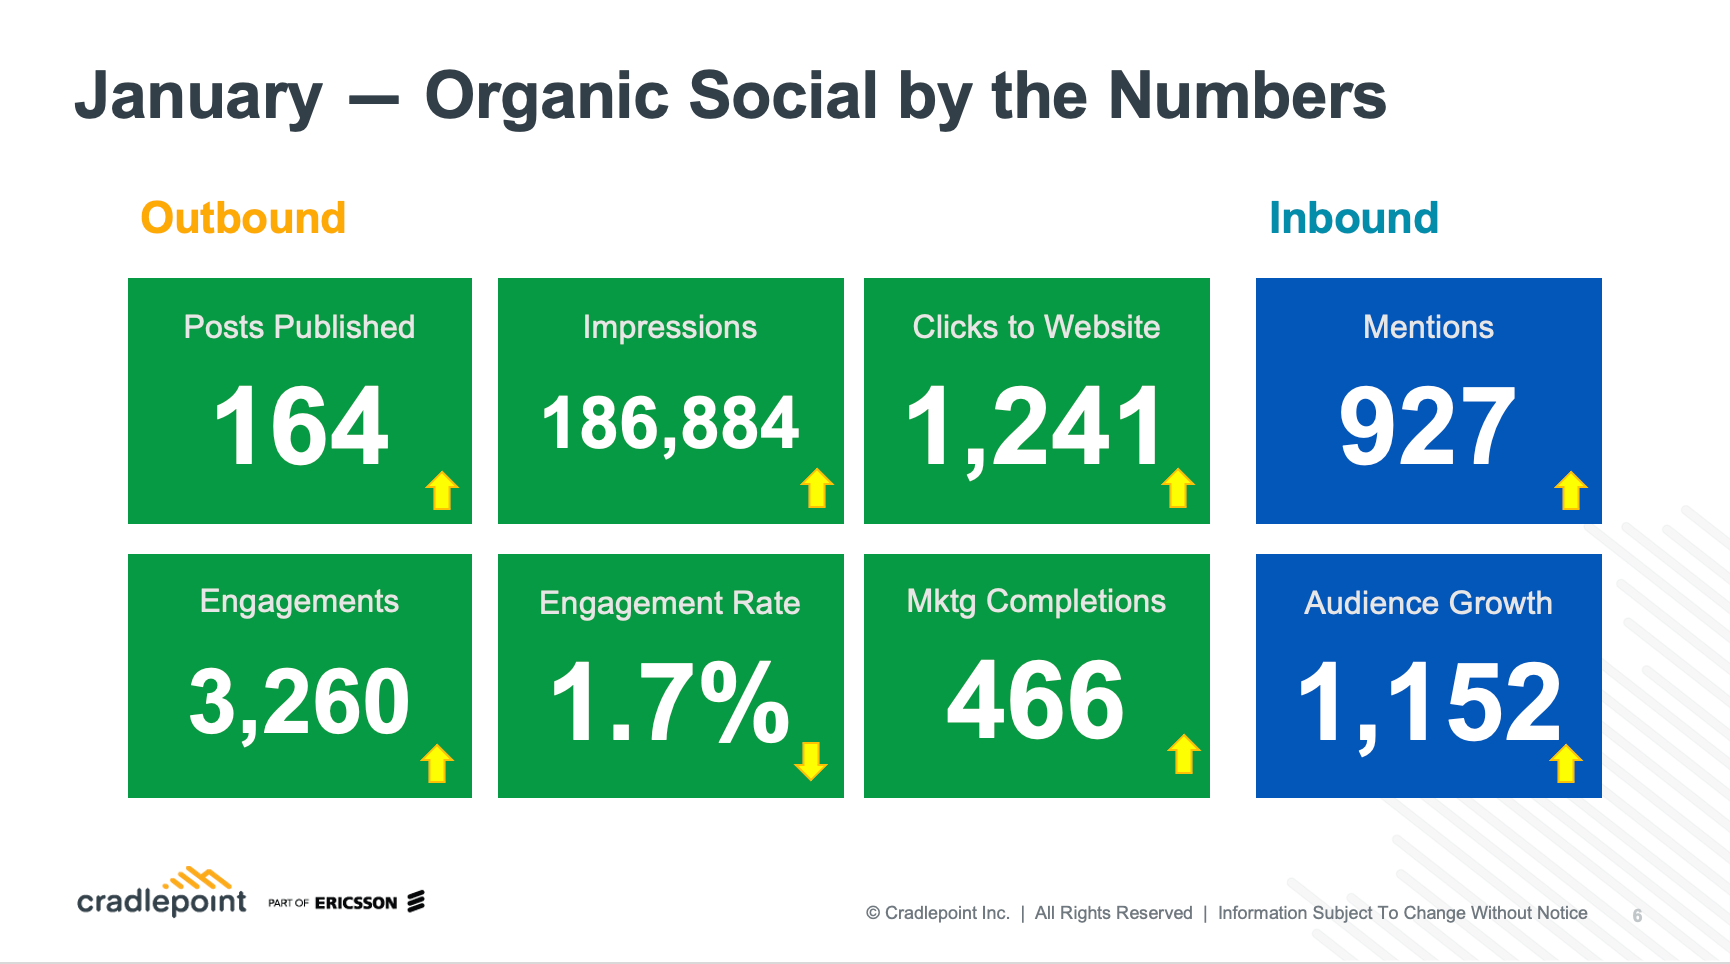
I’ve been tweaking a powerpoint presentation for the past year that I enter all the data from SproutSocial into. Granted, I get way too into the weeds when it comes to making my reports look fancy (I’m a designer..what do you expect?) but I am curious what others are doing to present all this great data in a “pretty” way. 


icon

Best answer by payton.prall 23 February 2024, 17:53

View original

7 replies

Userlevel 1

Ugh- I do the same thing! I have not found a solution to this as I need it to look nice and I need to provide insights in a deck form like this.  :( Curious if any others have thoughts too. 

Userlevel 3
Badge +3

Wish mine Looked like this! Because of my bandwidth, I’m just posting screenshots from Sprout and adding notes 🤢

Userlevel 3
Badge +1

Mine is all spreadsheets. Our executive director is a CPA, so it’s easier for her to understand. I export to CSV and edit from there. 

The “My Personal Report” Beta feature has honestly been really helpful for me! It has all of the capabilities in the report that you put together, as well as ways to add graphs/visuals. I suppose you probably have to have premium analytics though...

Hello fellow CU social media person! 


I struggle with the same thing! We’re using spreadsheets for each platform separately, and Financial Brand Top 100 rankings. Your PowerPoint deck inspires me to make something like you have.


-Julie, Redwood CU

Userlevel 4
Badge +1

Hello fellow CU social media person! 


I struggle with the same thing! We’re using spreadsheets for each platform separately, and Financial Brand Top 100 rankings. Your PowerPoint deck inspires me to make something like you have.


-Julie, Redwood CU

Julie - Nice to see another credit union social manager on here! Your social content is great. However..the Financial Brand Top 100 angers me 😁

Userlevel 5
Badge +1

I keep mine very high level for exec leadership with this slide and then I have a second one that shares top 5 posts and why they were top 5 (highlighting impressions, engagement rate, video views, et al). I try to tell a story about why posts worked (timed with a trade show, new approach, supporting a key business pillar (like women in tech)). Product managers will also ask for metrics for specific launches, so while I don’t have “benchmarks” yet to say what metrics are good, I’m using the tagging feature to quickly pull figures for them and I share that as well. I’ve learned Google Analytics so I can show managers that social is driving clicks to website and we are leading prospects to sign up for webinars, read blog posts, etc. 


Reply